
Single-screen operational clarity.
Real-world dashboard layouts built for mid-market operations, logistics, and finance teams. Every custom interface replaces manual compilation with direct, automated API pipelines to eliminate weekly reporting friction.


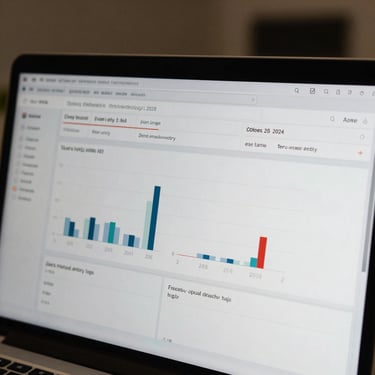
Active client dashboards
High-fidelity interface crops showing real-time operational metrics, automated pipeline statuses, and financial performance views. These production-ready dashboards are built specifically for rapid executive decision-making.


Measurable pipeline performance
We replace fragile spreadsheet chains with automated data pipelines. These verified client metrics demonstrate the operational impact of single-screen dashboards across logistics, finance, and e-commerce sectors.
15 hours saved
Zero entry errors
3-second loading
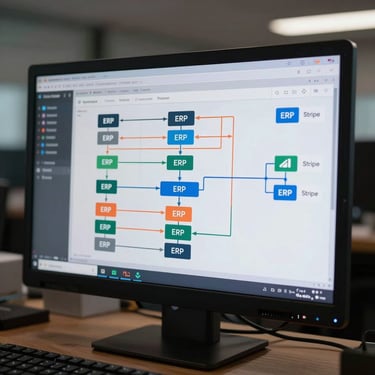
Direct Stripe API integrations replaced manual reconciliation spreadsheets entirely, establishing a single source of truth and eliminating human data entry errors for the finance team.
Consolidated multiple Shopify and CRM data sources into one high-performance dashboard that updates automatically every hour, giving executives instant visibility into customer acquisition costs.
Automated ERP pipelines eliminated fifteen hours of manual weekly dispatch reporting completely, allowing the operations director to monitor fleet efficiency in real time.
Automate your reporting
Stop wasting weekends on manual data entry and spreadsheet formatting. Let us build a clean, automated dashboard tailored precisely to your company's operational pipelines.